Start a Project
What we do
Capabilities Services Industries
Work
Company
About Careers Contact
Start a Project
Selected work 09

Integrated helm display and control system for a fishing vessel.

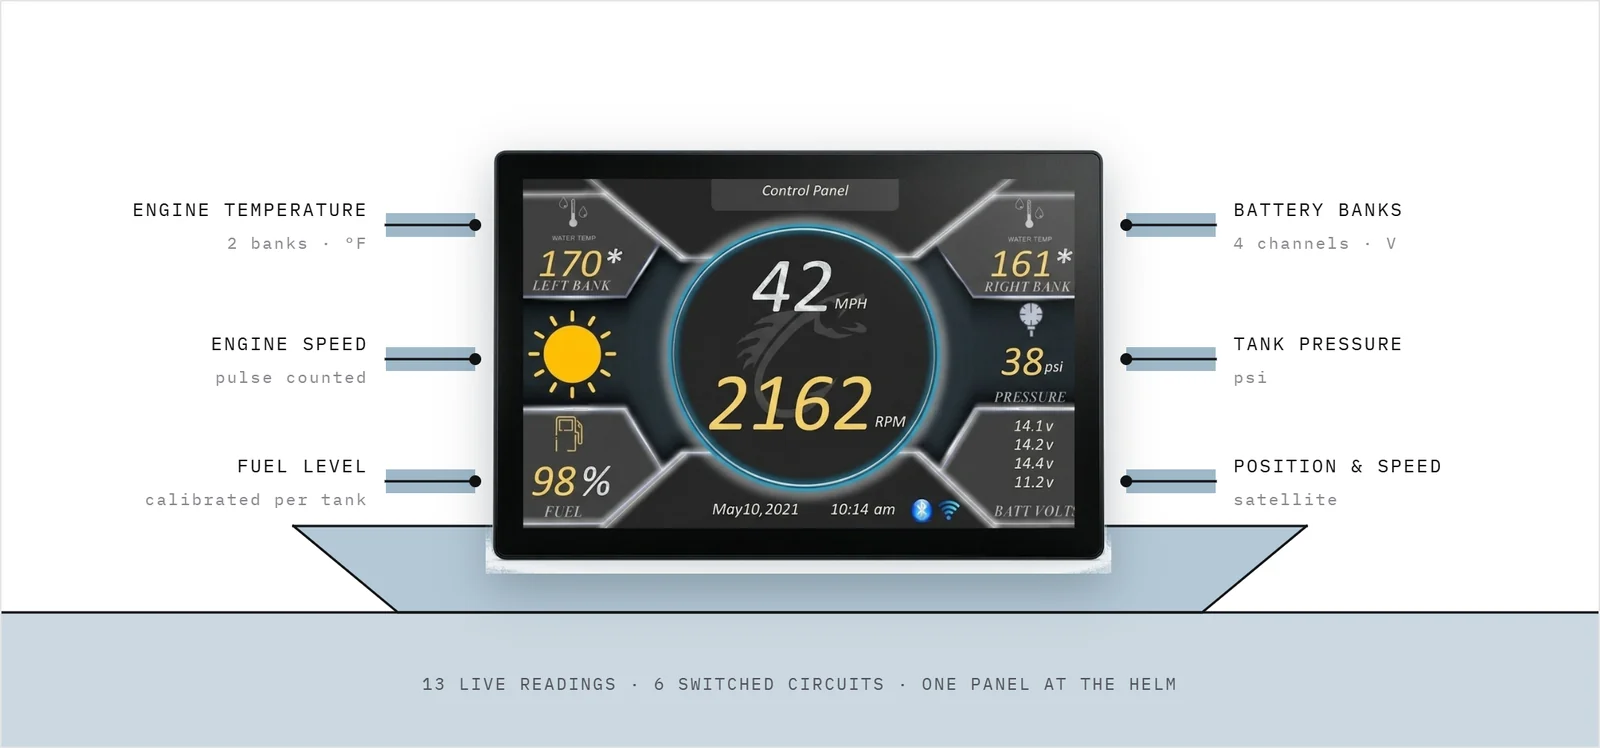
A touchscreen helm system that combined vessel instrumentation and electrical controls into a single embedded interface. It read thirteen live parameters, controlled six switched circuits, handled signal processing and calibration, and started automatically with the vessel.
Industry
Marine and offshore systems
Stage at start
Concept, with no existing architecture, interface or instrumentation design
Volvix Systems role
System architecture, instrumentation, embedded firmware, signal processing, touchscreen interface, control logic, calibration and commissioning
The helm display at the centre of a vessel section, with callouts naming the six sensed inputs it reads
01 / The brief

The vessel had the information required for operation, but it was spread across separate gauges and switches.

Engine temperature, battery voltage, fuel level and pressure were displayed independently, while pumps, lights and other equipment were controlled through physical switches.

The client wanted to bring monitoring and control together on a single touchscreen at the helm.

The system also needed to support future use across different boats, so the design could not depend on one specific engine, sensor or wiring configuration.

02 / The engineering problem

Handling several different signal types without allowing slower measurements to interfere with time sensitive ones.

The system had to process variable resistance sensors, battery voltages, current loop pressure sensing, temperature signals, engine speed pulses and serial data from a satellite receiver, while also controlling six relay outputs.

One temperature measurement method tested during development could take 100 to 150 milliseconds to return a reading. Processing it sequentially could interfere with engine speed measurement and reduce system responsiveness.

We therefore separated time sensitive measurements from slower instrumentation and structured the system so each signal could be processed appropriately.

The system also had to handle power interruptions, operate in a marine environment, start automatically and provide understandable fault handling without exposing the underlying operating system.

03 / What we engineered

A dedicated controller for the boat, a display for the operator, and a deliberately plain boundary between them.

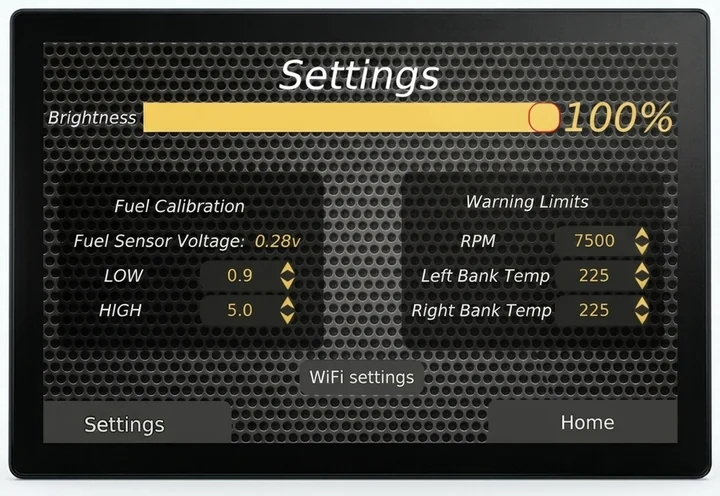
01System architecture — The system was split into a dedicated controller and a touchscreen display. The controller handled sensor acquisition, signal processing and output control, while the display handled the user interface. A simple communication layer connected the two. 02Signal processing — Engine speed was measured using interrupts to capture incoming pulses without blocking the main control loop. Fuel, pressure and temperature readings were filtered using rolling averages to reduce fluctuations caused by vessel movement. 03Calibration — The calibration interface exposed raw sensor values and allowed empty and full points to be defined for the installed tank. 04Touchscreen interface — The interface was designed for a 1280 by 800 display and included the live dashboard, switching controls, calibration and network configuration. Six outputs were controlled through the interface, including an automatic livewell cycle. 05Startup and recovery — The system booted directly into the application, retained configuration across power cycles and reported controller communication failures through the interface. When communication was lost, the display attempted to recover automatically rather than leaving the operator at the operating system level.
04 / The interface

The interface was designed for operation at the helm.

The main dashboard kept the key vessel readings visible together, while separate screens provided access to controls, calibration and configuration.

The controls were designed specifically for touchscreen operation rather than conventional desktop interaction.
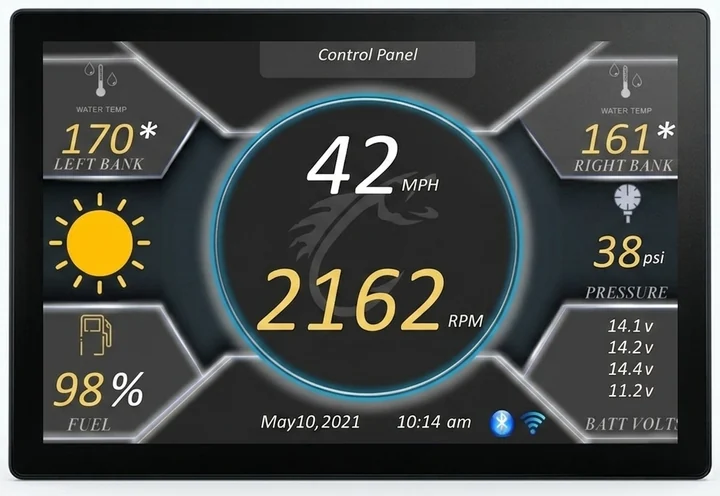
The main dashboard, showing boat speed and engine RPM at centre with water temperature for both banks, fuel level, tank pressure and four battery voltages around it
Dashboard
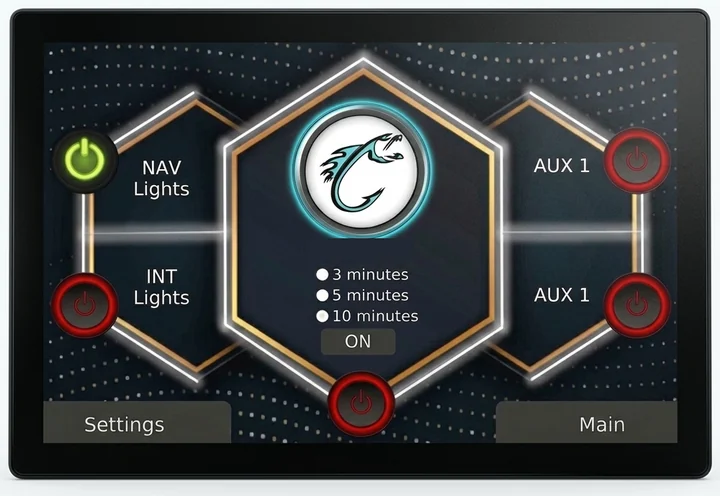
The switching page, with six circuits arranged around a central control that sets the livewell cycle to a three, five or ten minute rest period
Switching controls
The settings page, showing the live fuel sender voltage with its low and high calibration points beside warning limits for engine speed and both bank temperatures
Calibration
Operator interface
One screen per task, sized for wet hands.
Switching sits on its own page so a circuit cannot be thrown while reading instruments, and calibration keeps the raw sender value next to the points being set.
05 / Where it stands

Thirteen live readings and six switched circuits on one screen.
Before
Separate gauges and a row of physical switches, with nothing in one place.
After
One touchscreen carrying the instrumentation and the switch panel, starting with the vessel, holding its configuration through power cycles and tested on the water.
Next
A production version was scoped around a vessel data bus, recorded trend history and a helm camera feed.
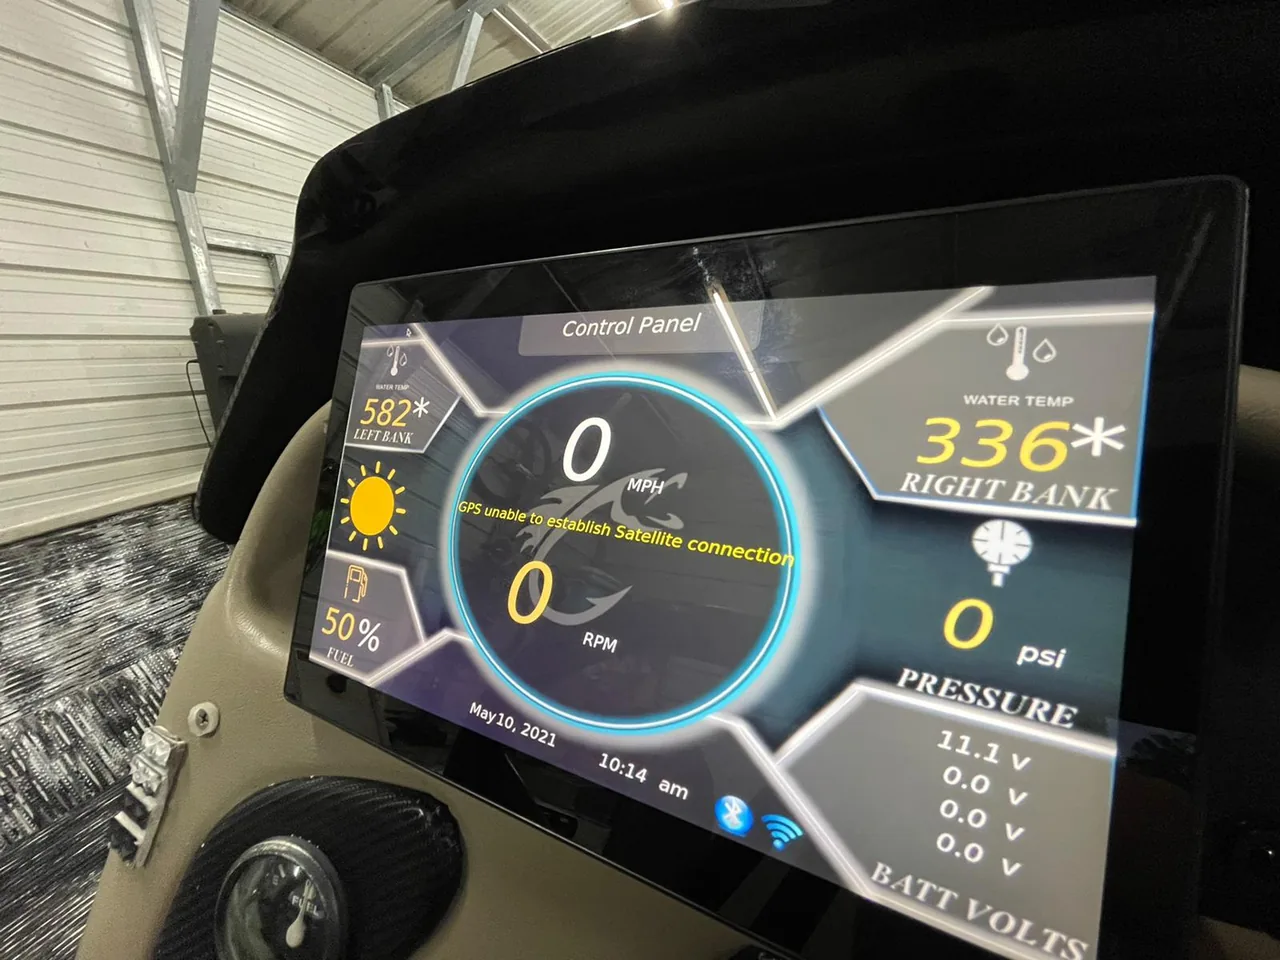
The unit powered up during testing, with a warning on screen that the satellite receiver has not acquired a fix
Fig. 01 — Powered up during testing, before the receiver had acquired a fix.

Have a product or system you’re trying to build?

Tell us what you are working on and what you need help with.

Start a Project